Minist&ecute;rio da Ciência e Tecnologia Acesse o Portal do Governo Brasileiro
Monitoring the Transport of Biomass Burning and Anthropogenic Pollution in South America
Abstract
The atmospheric transport of biomass burning and anthropogenic emissions over South America and Africa continents and South Atlantic Ocean is monitored by CPTEC/INPE on an operational basis<www.cptec.inpe.br/qualidade_do_ar>. A real time operational monitoring transport system was implemented in 2003 using the on-line 3-D transport model CATT-BRAMS (Coupled Aerosol and Tracer Transport model to the Brazilian developments on the Regional Atmospheric Modelling System) coupled to an emission model. In this model, the mass conservation equation is solved for carbon monoxide (CO) and particulate material PM2.5. Source emissions of gases and particles associated with biomass burning activities in tropical forest, savanna and pasture are parameterized and introduced in the model. The sources are spatially and temporally distributed and daily assimilated according to the biomass burning spots obtained by remote sensing (AVHRR, MODIS and GOES-12). Anthropogenic sources of CO are also included following the EDGAR/RETRO/CETESB databases. The advection, at grid scale, is a forwardupstream scheme of second-order, the horizontal diffusion is based on the Smagorinsky formulation and the vertical diffusion is parameterized according to the Mellor and Yamada scheme, which employs a prognostic of the turbulent kinetic energy. A sub-grid transport parameterization, associated to wet, deep and shallow circulation not explicitly resolved by the model due to its low spatial resolution, is also introduced. The plume rise sub-grid scale transport associated to vegetation fires is simulated by embedding a 1D cloud resolving model, with appropriate lower boundary conditions, in each column of CATT-BRAMS host model. Sinks, associated with generic processes of removal/transformation of gases and particles, are parameterized and introduced in the mass conservation equation.
Model development historical
The present model development was initiated during the Ph. D. program of Saulo Freitas and Karla Longo at the Physics Institute of the University of São Paulo under the supervision of Professor Maria Assunção Silva Dias and Professor Paulo Artaxo. Further improvements were carried out at NASA Ames Research Center in collaboration with Dr. Robert Chatfield. Today, the model development under progress at CPTEC-INPE is carried out in collaboration with University of São Paulo.
Model Description
BRAMS - Brazilian developments on the Regional Atmospheric Modeling System
BRAMS (www.cptec.inpe.br/brams) is based on the Regional Atmospheric Modeling System (RAMS, Walko et al., 2000) version 6 with several new functionalities and parameterizations specialized for the tropics and sub-tropics. RAMS is a multipurpose, numerical prediction model designed to simulate atmospheric circulations spanning in scale from hemispheric scales down to large eddy simulations (LES) of the planetary boundary layer (Walko et al., 2000, www.atmet.com). The equation set used is the quasi-Boussinesq non-hydrostatic equations described by Tripoli and Cotton (1982). The model is equipped with a multiple grid nesting scheme which allows the model equations to be solved simultaneously on any number of interacting computational meshes of differing spatial resolution. It has a complex set of packages to simulate processes such as: radiative transfer, surface-air water, heat and momentum exchanges, turbulent planetary boundary layer transport and cloud microphysics. The initial conditions can be defined from various observational data sets that can be combined and processed with a mesoscale isentropic data analysis package (Tremback, 1990). For the boundary conditions, the 4DDA schemes allow the atmospheric fields to be nudged towards the large-scale data. BRAMS features used in this system include an ensemble version of deep and shallow cumulus scheme based on the mass flux approach (Grell and Devenyi, 2002) and soil moisture initialization data (Gevaerd and Freitas, 2006)
Some of the following model parameterizations are used in the model:
  • The horizontal diffusion coefficients are based on the Smagorinsky (1963) formulation.
  • The vertical diffusion is parameterized according to the Mellor and Yamada (1974) scheme, which employs a prognostic of the turbulent kinetic energy.
  • The surface-atmosphere water, momentum and energy exchange are simulated by the Land Ecosystem Atmosphere Feedback model (LEAF-3), which represents the storage and vertical exchange of water and energy in multiple soil layers, including effects of freezing and thawing soil, temporary surface water or snowcover, vegetation, and canopy air (Walko et al., 2000).
  • The advection scheme is a forwardupstream of second-order Tremback et al, (1987).
  • Bulk microphysics (Walko et al., 2000)
  • Convective cumulus scheme for deep and shallow convection based on Grell and Devenyi (2002).
  • The 4D Data Assimilation (4DDA), a nudging type scheme in which the model fields can be nudged toward observational data assimulation progresses.
Coupled Aerosol and Tracer Transport model coupled to BRAMS (CATT-BRAMS)
CATT-BRAMS explores the BRAMS tracer transport capability of using slots for scalars. The in-line model transport follows the Eulerian approach, solving the mass conservation equation for carbon monoxide (CO) and particulate material PM2.5, where the tracer mixture ratio, s (=ρ/ρair), is calculated using the mass conservation equation (using tendencies notation)

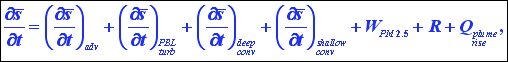
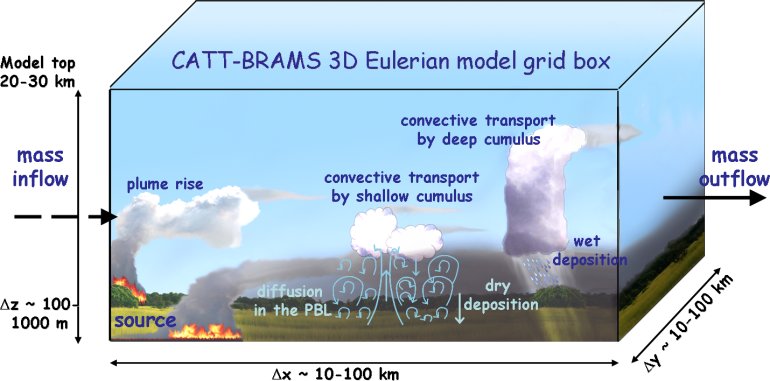
where adv, PBL turb and deep(shallow) conv stand for grid-scale advection, sub-grid transport in the planetary boundary layer (PBL) and sub-grid transport associated to moist and deep (shallow, non-precipitating) convection, respectively. W accounts for the convective wet removal for PM2.5, R is a sink term associated with generic process of removal/transformation of tracers (dry deposition and sedimentation for PM2.5 and chemical transformation for CO), and Qplume-rise is the source emission associated to the biomass burning process including the plume rise mechanism.
The advection, at grid scale, is a forwardupstream scheme of second-order, the horizontal diffusion is based on the Smagorinsky formulation and the vertical diffusion is parameterized according to the Mellor and Yamada scheme. The sub-grid transport associated with deep and shallow convective transport is coupled to the Grell cumulus scheme. For PM2.5, the tracer convective transport scheme accounts also for the wet (in and below cloud) removal based on the work of Berge (1993). The plume rise associated to the vegetation fires is included following the super-parameterization concept (Freitas et al., 2006, 2007). Dry deposition and sedimentation follows the resistance approach. Figure 1 illustrates several sub-grid atmospheric processes simulated by CATT-BRAMS. Also, an additional radiation parameterization, which takes the interaction between aerosol particles and short and long wave radiation using the rapid two-stream approximation (Toon, et al., 1989) and the aerosol scattering and absorption calculated with the Mie code for stratified spheres (Toon and Ackerman, 1981) was implemented. For smoke aerosols, a dynamic model, derived from three years of optical properties retrievals from some of the Amazonian AERONET sites measurements, is used (Procópio et al., 2003).
Figure 1. Some sub-grid process involved at gases/aerosols transport and simulated by CATT-BRAMS model.
Source emission parameterization
A biomass burning tracer emission parameterization based on the work of Freitas (1999) was implemented. The biomass burning source emission parameterization (for CO, CO2, CH4, NOx and PM2.5) is based on the GOES-12 WF_ABBA fire product (Prins et al., (1998), http://cimss.ssec.wisc.edu/goes/burn/abba.html) GOES-12, AVHRR and MODIS fire observation from CPTEC-INPE (http://www.cptec.inpe.br/queimadas/), and field observations. For each fire detected by remote sensing, the mass of emitted tracers is calculated (details: source emission ) and its emission in the model follows a diurnal cycle of the burning (emission rate
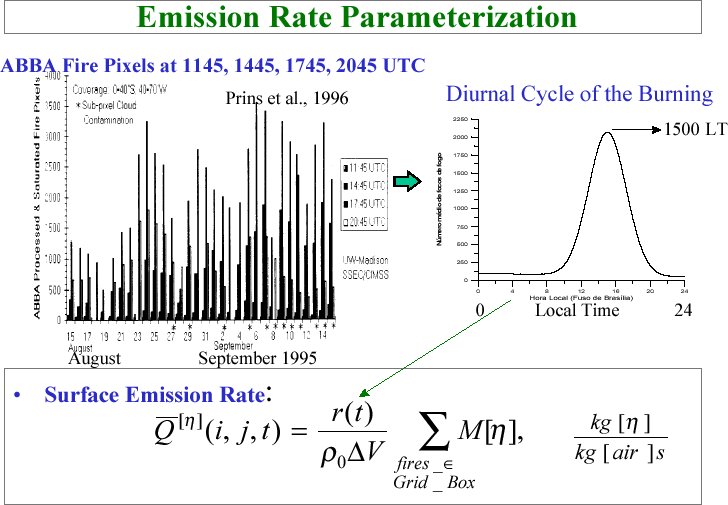
 ). The type of 
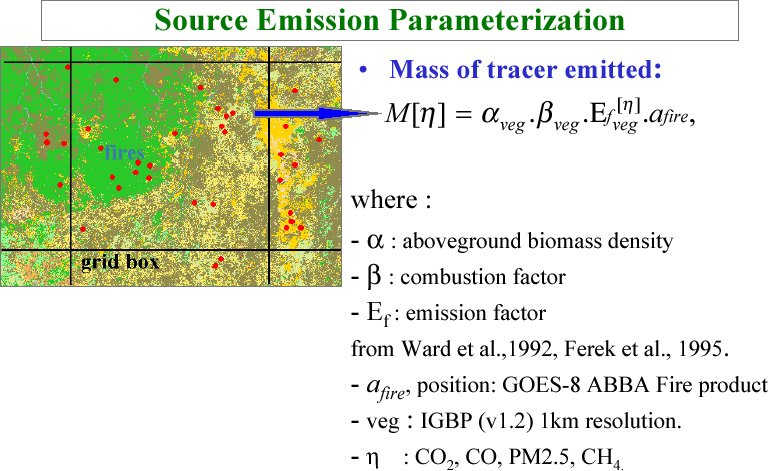
vegetation that is burning is obtained from the IGBP-INPE 1km vegetation map (http://edcdaac.usgs.gov/glcc/glcc.html) and (http://www.cptec.inpe.br/proveg/). The sources are spatially and temporally distributed and daily assimilated according to the biomass burning spots defined by the satellite observations (Figure 2). The 
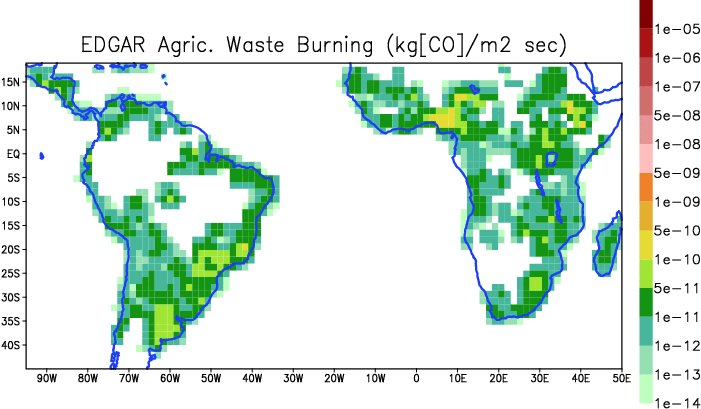
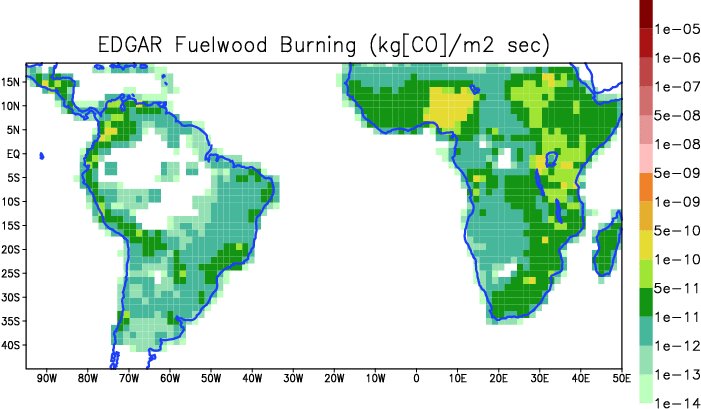
biomass burning emissions are added with the EDGAR agricultural waste burn and fuelwood burning emissions with 1x1 degree horizontal resolution and 1 year time resolution (see pictures
). On African continent, the biomass burning emissions are defined always following the GFEDv2 prescription.
The carbon monoxide emissions associated to anthropogenic processes (industrial, power generation, transportation, etc.) is provided by the EDGAR/RETRO databases with a CETESB correction for São Paulo Metropolitan Area (CETESB/2002).

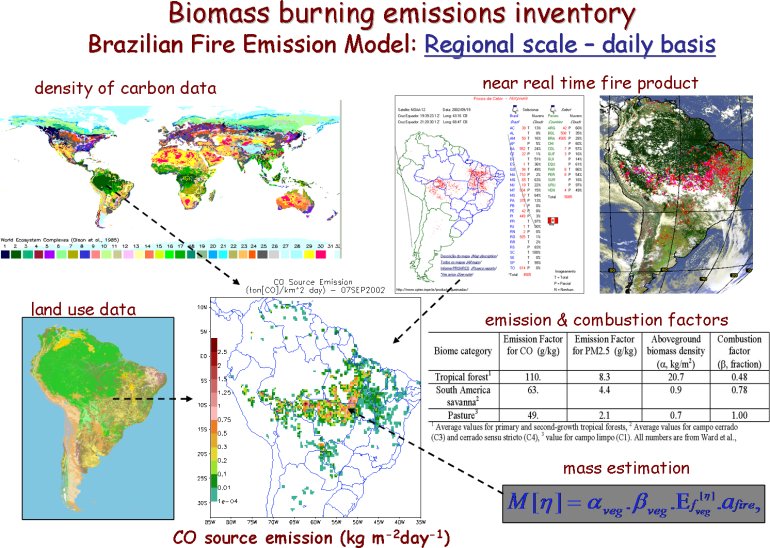
Figure 2. Biomass burning emissions inventory used by CATT-BRAMS model.

Product description
Model configuration, initial and boundary conditions
The model is set up with 3 grids at horizontal resolution of 150, 30 km and 15 km (Figure 3). The vertical resolution starts at 150 m near the surface, stretching at a rate of 1.15 to a final resolution of 850 m, with the model top at about 20 km. The coarse grid, covering the South American and African continents, is intended to generate the tracer inflow from Africa to South America. The atmospheric model is initialized and nudged with the CPTEC global model (6 hours 1.875 degrees) analysis/forecast data. The 3D tracer concentration fields of the previous run are used as the tracer initial condition for the next, and the constant inflow condition is used to the tracer boundary condition in the coarse grid. The simulation is performed for 48 hours, beginning at 00 UTC of the previous day. The soil moisture is initialized based on the antecedent precipitation index method (Gevaerd and Freitas, 2006). Analysis and forecast of carbon monoxide and aerosol particles mass concentration, aerosol optical thickness, and aerosol particle mass wet deposited fields are provided daily at www.cptec.inpe.br/qualidade_do_ar. Comparison of model results with remote sensing aerosol and trace gas products and direct measurements have demonstrated the good predictability skills of the model.

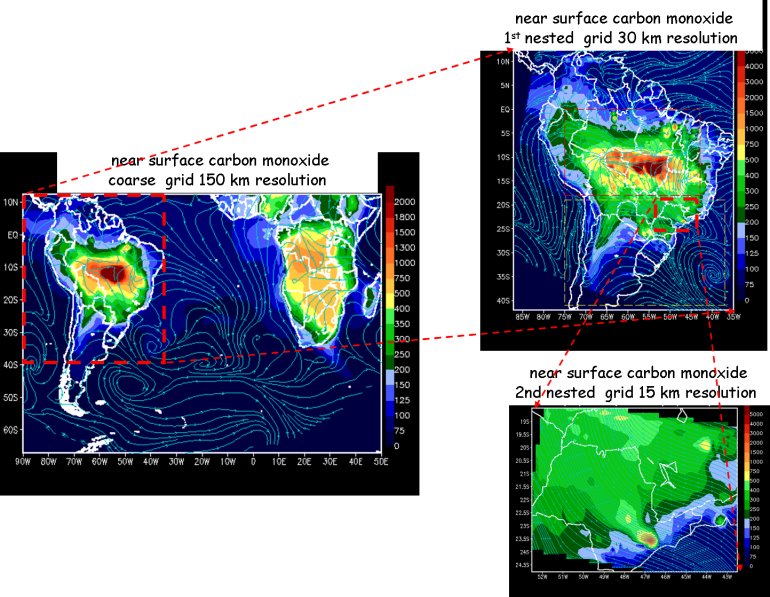
Figure 3. Operational model grids

Model comparison and evaluation with observational and remote sensing data for 2002 dry season
Model evaluation with SMOCC/RaCCI 2002 surface and airborne measurements Figure 4 shows two time series with a comparison of surface CO and PM2.5 from model and observation. An intercomparison of PM2.5 and CO model results at 1200 UTC with daily averages of the measurements values centered at 1200 Z reveals good agreement in terms of the general pattern of temporal evolution and values.

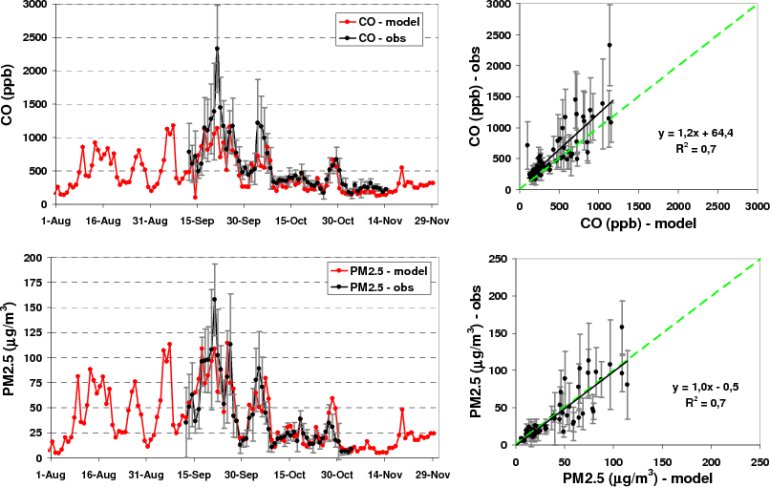
Figure 4. Time series with comparison between near surface CO (ppb, top) and PM2.5 (g m-3, bottom) observed (black) and model results (red). The measurements were daily averaged and centered at 1200 Z. The error bars are the standard deviations of the mean values. The model results are presented as instantaneous values at 1200 UTC.

Comparison of simulated CO profiles in the PBL and lower troposphere with observed data were performed using SMOCC/RaCCI campaign airborne measurements. Figure 5 shows comparisons for sixteen flights. The mean and STD of the observed CO profiles are shown; note that STD represents the actual variability of the concentrations, not the measurement error.

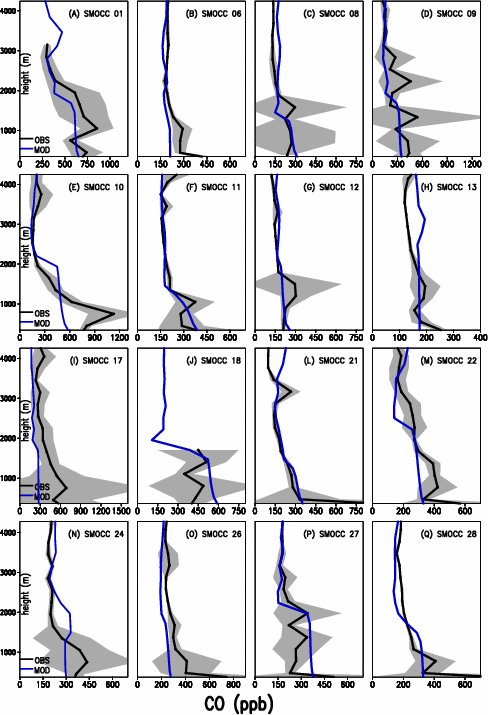
Figure 5. Comparison between CO (ppb) observed during sixteen flights of the LBA-SMOCC/RaCCI field campaign (black solid line represents the mean while the grey zone shows the standard deviation range) and model results (blue).

The overall model performance can be evaluated in Figure 6, where the mean CO observed profile and its STD are presented together with the mean CO model. The model result is very consistent with the observed mean, being always inside of the STD range. Figure 6 also indicates that the model is able to accurately capture the vertical distribution of the observed concentrations.

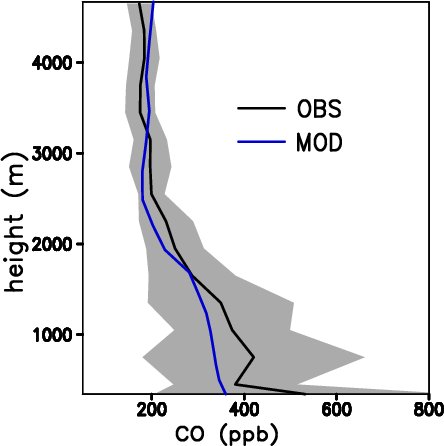
Figure 6. Comparison between the mean CO (ppb) observed during sixteen flights of the LBA-SMOCC/RaCCI field campaign (black solid line represents the mean while the grey zone shows the standard deviation range) and the mean of model results (blue).

5.2 Model comparisons with MOPITT data
Model performance on larger scales and including upper tropospheric levels is evaluated in this section, using data retrieved by the Measurements of Pollution in the Troposphere (MOPITT) instrument, onboard the Earth Observing System Terra satellite. MOPITT retrievals of tropospheric CO mixing ratio (ppb) are reported for 7 pressure levels, from the surface to 150 hPa (Deeter et al., 2003). Because MOPITT data have large horizontal areas without valid data due to swath width and cloud cover, the model results, after applying the averaging kernel and a priori profile, and using retrievals with < 50% a priori contribution, and MOPITT data were monthly averaged. Figure 7 shows the comparisons for the months August, September and October on five vertical levels (850, 700, 500, 350 and 250 hPa) at the large scale grid. The quantity depicted in the above-mentioned figure is the relative model error (ME) defined as
,
where COmodel is the monthly mean of model CO mixing ratio after applying the averaging kernel and a priori fraction < 50%.

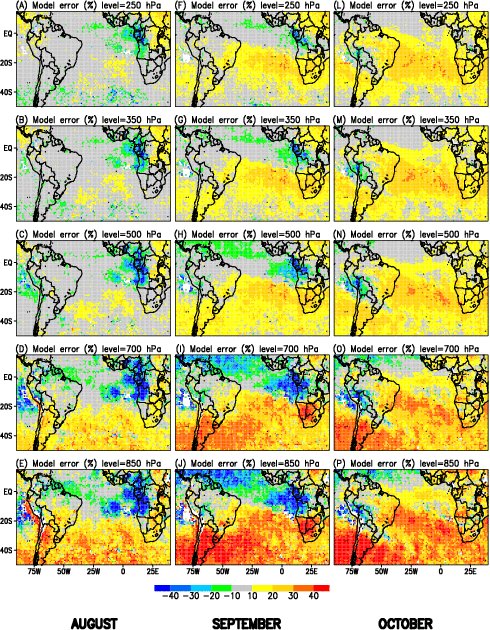
Figure 7. CO model relative error (%) relative to the MOPITT CO retrieval for the months August, September and October 2002 at five vertical levels (850, 700, 500, 350 and 250 hPa). Positive values mean that model results are underestimated in reference to the MOPITT retrieved data and vice-versa.

An upper troposphere study (September 7 to 9, 2002 cold front convective case)

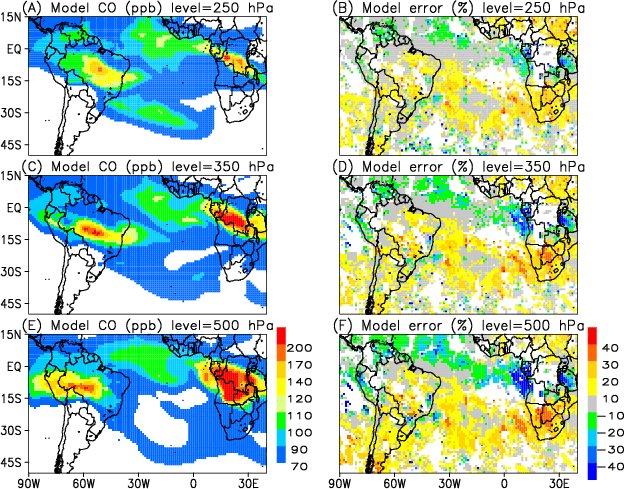
Figure 8. Model CO mixing ratio (ppb, on the left) and the model error relative to the MOPITT CO retrievals (%, on the right) at 250, 350 and 500 hPa. Model and MOPITT data were time averaged over the days 6, 7, 8 and 9 September 2002. White areas, on the right, denote places without valid data for MOPITT during the time average period.

5.2 Model comparisons with MODIS/TERRA data
Comparison of the aerosol optical thickness (550 nm channel) derived from MODIS-TERRA observation and calculated from the model (combination of the regional grid and coarse grid) for August 27 2002. A smoke corridor is evident that was associated with an anticyclone circulation centered over the Atlantic Ocean. The long-range transport of smoke results in transboundary air pollution with smoke- laden air crossing into South American countries, like Paraguay, Argentina and Uruguay.

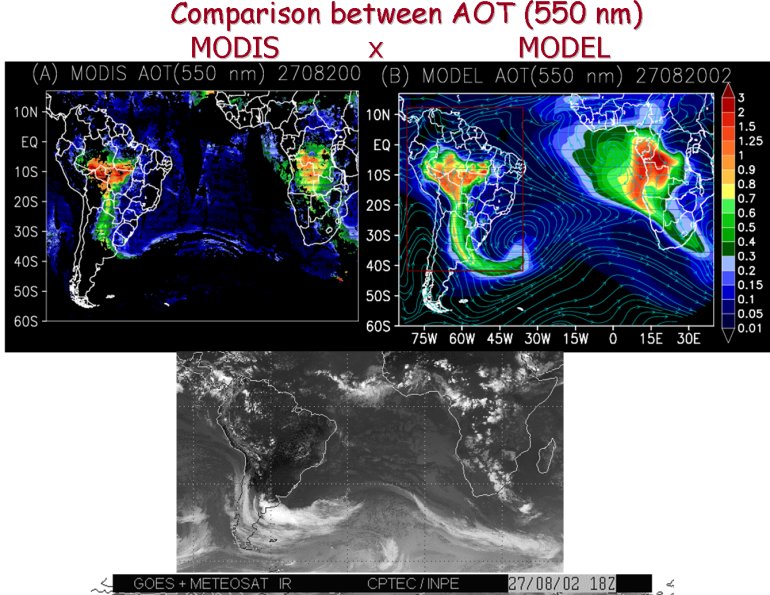
Figure 9. Model and MODIS AOT (550 nm) comparison.

Winds and columnar particulate material for August 25 2002. The detail shows the true color image from MODIS-TERRA observation at 14:05 Z at the same day.
References

Deeter, M. N., Emmons, L. K., Francis, G. L., Edwards, D. P., Gille, J. C., Warner, J. X., Khattatov, B., Ziskin, D., Lamarque, J.-F., Ho, S.-P., Yudin, V., Atti� J.-L., Packman, D., Chen, J., Mao, D., Drummond, J. R.: Operational carbon monoxide retrieval algorithm and selected results for the MOPITT instrument, J. Geophys. Res., 108(D14), 4399, doi:10.1029/2002JD003186, 2003.

Freitas, S. R., K. Longo, M. Silva Dias, P. Silva Dias. Emiss�s de queimadas em ecossistemas da Am�ica do Sul. Estudos Avan�dos 19 (53), p.167-185. ISSN 0103-4014, 2005.

Freitas, S. R., K. Longo, M. Silva Dias, P. Silva Dias, R. Chatfield, E. Prins, P. Artaxo, G. Grell and F. Recuero. Monitoring the transport of biomass burning emissions in South America. Environmental Fluid Mechanics, DOI:10.1007/s10652-005-0243-7, 5 (1-2), p. 135 167, 2005.

Freitas, S. R., Longo, K. M., and Andreae, M. O.: Impact of including the plume rise of vegetation fires in numerical simulations of associated atmospheric pollutants, Geophys. Res. Lett., 33, L17808, doi:10.1029/2006GL026608, 2006.

Freitas, S. R., K. Longo, M. Dias, R. Chatfield, P. Dias, P. Artaxo, M. Andreae, G. Grell, L. Rodrigues, A. Fazenda and J. Panetta.: The Coupled Aerosol and Tracer Transport model to the Brazilian developments on the Regional Atmospheric Modeling System (CATT-BRAMS). Part 1: Model description and evaluation. Atmos. Chem. Phys. Discuss., 7., 8525-8569, 2007.

Gevaerd, R., and Freitas, S. R.: Estimativa operacional da umidade do solo para inicia�o de modelos de previs� num�ica da atmosfera. Parte I: Descri�o da metodologia e valida�o, Revista Brasileira de Meteorologia, 21, 3, 1-15, 2006.

Grell, G. A., and Dezso Devenyi. A generalized approach to parameterizing convection combining ensemble and data assimilation techniques. Geophysical Research Letters, VOL. 29, NO. 14, 2002.

Longo, K. M.; Freitas, S. R.; Silva Dias, M.A.F. Dias, P. Silva Dias. Numerical modeling developments towards a system suitable to a real time air quality forecast and climate changes studies in South America. Newsletter of the International Global Atmospheric Chemistry Project, Taiwan, v. 33, p. 12-16, 2006.

Longo, K., S. R Freitas, A. Setzer, E. Prins, P. Artaxo, and M. Andreae. The Coupled Aerosol and Tracer Transport model to the Brazilian developments on the Regional Atmospheric Modeling System (CATT-BRAMS). Part 2: Model sensitivity to the biomass burning inventories. Atmos. Chem. Phys. Discuss., 8571-8595, 2007.

Mellor, G.L., and T. Yamada, 1974: A hierarchy of turbulence closure models for planetary boundary layers. J. Atmos. Sci., 31, 1791-1806.

Prins, E. M., J. M. Feltz, W. P. Menzel and D. E. Ward. An Overview of GOES-8 Diurnal Fire and Smoke Results for SCAR-B and 1995 Fire Season in South America. J. Geophys. Res., 103, D24, 31821-31835, 1998.

Procopio, A. S., L. A. Remer, P. Artaxo, Y. J. Kaufman, B. N. Holben. Modeled spectral optical properties for smoke aerosols in Amaz�ia. Geo. Res. Letters, Vol. 30, N. 24, 2265, doi:10.1029/2003GL018063, 2003.

Smagorinsky, J., 1963: General circulation experiments with the primitive equations. Part I, The basic experiment. Mon. Wea. Rev., 91, 99-164.

Tremback, C.J., J. Powell, W.R. Cotton, and R.A. Pielke, 1987: The forward in time upstream advection scheme: Extension to higher orders. Mon. Wea. Rev., 115, 540-555.

Walko R., Band L., Baron J., Kittel F., Lammers R., Lee T., Ojima D., Pielke R., Taylor C., Tague C., Tremback C., Vidale P. Coupled Atmosphere-Biophysics-Hydrology Models for Environmental Modeling. J Appl Meteorol 39: (6) 931-944, 2000.

Ward, D. E., R. A. Susott, J. B. Kauman, R. E. Babbit, D. L. Cummings, B. Dias, B. N. Holben, Y. J. Kaufman, R. A. Rasmussen, A. W. Setzer. Smoke and Fire Characteristics for Cerrado and Deforestation Burns in Brazil: BASE-B Experiment. J. Geophys. Res., 97, D13, 14601-14619, 1992.